Tools for iOS Development
Xcode is the toolset you use to manage product development, edit and debug source code, design user interface components, analyze and improve application performance, perform source control operations with the Git and Subversion source control systems, submit your application to the App Store, and much more. At the center of this toolset is the Xcode application, which provides an integrated development environment that actively assists you in your development tasks.Manage Your Work
To develop an iOS application, you start by creating an Xcode project. A project manages all the information associated with your application, including the source files, user interface designs, and build settings needed to build your application. You work on your project through the workspace window, which provides quick access to all the elements that make up your application.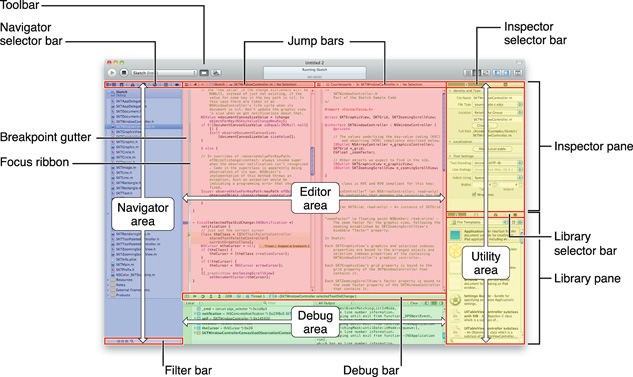
The workspace window is divided into four major areas: the navigator area, the editor area, the debug area, and the utility area.
- The navigator area is where you manage the files in your project, and other information, such as symbols, breakpoints, threads and stacks, warnings and errors, and logs about the activities you perform.
- The editor area is where you edit source files, design user interface components, configure project settings, and view other project information.
- The debug area contains panes you use to view variables in the current program execution scope, the threads and corresponding stacks of the running application, and its console output. You can also enter commands to the debugger.
- The utility area contains inspectors you use to configure the properties of a file or an object, and libraries you use to add preconfigured source files or user interface elements, among other types of resources, to your project.
If you need help performing a task, Xcode provides contextual help, which you can access directly from the user interface element about which you need help. This assistance includes easy-to-follow steps, videos or screenshots, and concise descriptions that help you get back to work quickly.
Edit Your Source Code Files
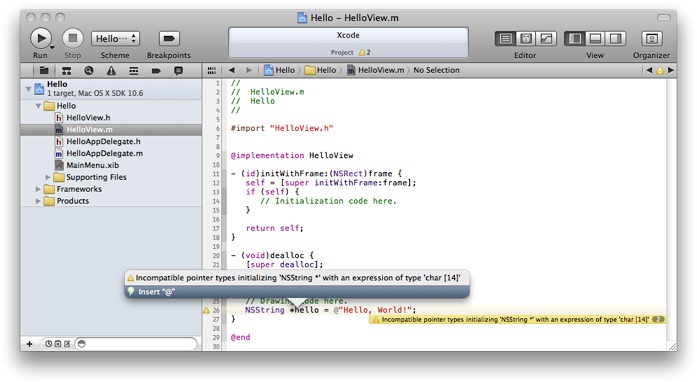
To help you work efficiently, the source code editor supports features such as code completion, syntax-aware indentation, and code folding (to hide code blocks temporarily). And if you need information about a particular symbol, you can get a summary of a symbol’s documentation directly in the editor.Xcode also helps you write better code by identifying common mistakes as you work and offering to fix those mistakes for you.
Design Your User Interface Components
Interface Builder is the editor you use to assemble your application’s user interface using preconfigured objects. The objects include windows, controls (such as switches, text fields, and buttons), and views you use to represent your application’s data in specialized ways. With this editor, you position objects, configure their properties, and establish relationships (or connections) between those objects and your code.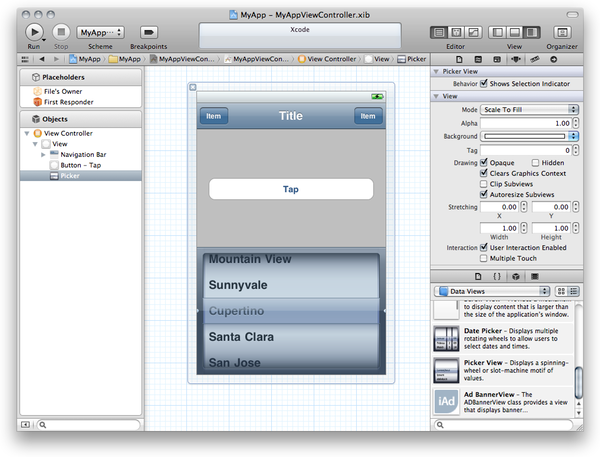
Interface Builder saves your designs in documents called nib files, which contain all the information iOS needs to reconstitute the same objects in your application at runtime.
Overall, using Interface Builder saves you a tremendous amount of time when it comes to creating your application’s user interface. Using this editor eliminates the custom code needed to create, configure, and position the objects that make up your user interface. Because it is a visual editor, you get to see exactly what your application’s user interface will look like at runtime.
Run Your Application
When you run your application to debug or test it, you can run it in iOS Simulator on your Mac and then on an iOS-based device. Using the simulator you can make sure your application behaves the way you want. After you are satisfied with your application’s basic behavior, you can run it on a device connected to your Mac. A device provides the ultimate testing environment, in which you can observe your application as it will behave on your customers’ devices.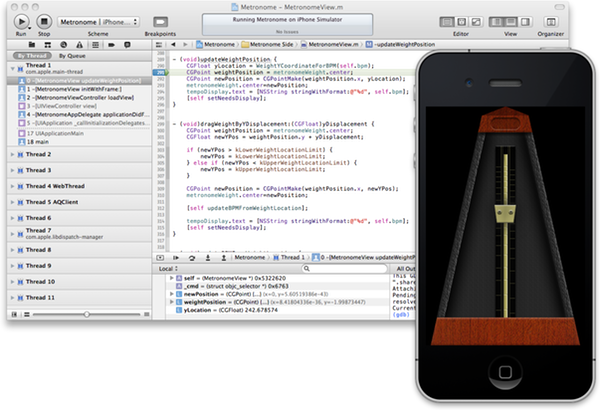
Improve the Performance of Your Application
To ensure that you deliver the best user experience for your software, use the Instruments application to analyze the performance of your application as it runs in the simulator or on a device. Instruments gathers data from your running application and presents it in a graphical timeline.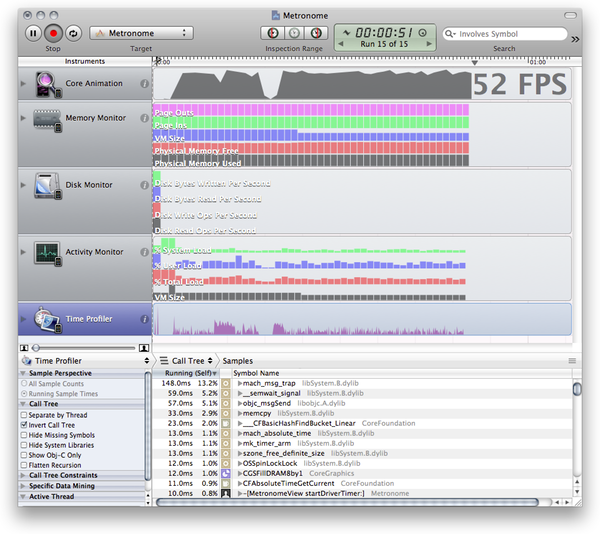
You can gather data about your application’s memory usage, disk activity, network activity, and graphics performance, among other measurements. By viewing the data together, you can analyze different aspects of your application’s performance to identify potential areas of improvement. You can also compare your application’s behavior at different times to determine whether your changes actually improve the performance of your application.
Distribute Your Application
Xcode makes it easy to share your application with testers before release, and to publish it on the App Store. In this process, you create an archive of your application. This archive contains debugging information that you may need to investigate bugs reported by users of your application.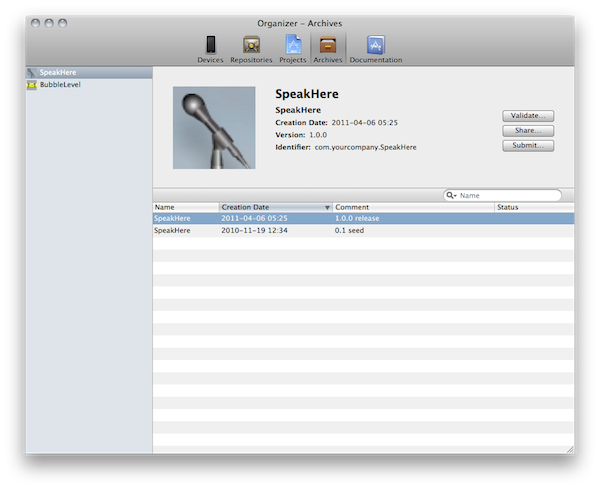
Xcode also performs essential validation tests required for App Store publication. Passing these tests ensures that your application’s approval process is a fast as possible.
No hay comentarios:
Publicar un comentario